also virusscan hab ich erst gemacht- da ist alles sauber- vllt ist auch der rechner zu schwach. asus x54c i3 8gb ram.
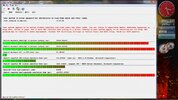
hier mal der latencymon report
CONCLUSION
_________________________________________________________________________________________________________
Your system appears to be having trouble handling real-time audio and other tasks. You are likely to experience buffer underruns appearing as drop outs, clicks or pops. One or more DPC routines that belong to a driver running in your system appear to be executing for too long. One problem may be related to power management, disable CPU throttling settings in Control Panel and BIOS setup. Check for BIOS updates.
LatencyMon has been analyzing your system for 0:04:13 (h:mm:ss) on all processors.
_________________________________________________________________________________________________________
SYSTEM INFORMATION
_________________________________________________________________________________________________________
Computer name: MAGNUS
OS version: Windows 7 Service Pack 1, 6.1, build: 7601 (x64)
Hardware: K54C, ASUSTeK Computer Inc.
CPU: GenuineIntel Intel(R) Core(TM) i3-2330M CPU @ 2.20GHz
Logical processors: 4
Processor groups: 1
RAM: 8096 MB total
_________________________________________________________________________________________________________
CPU SPEED
_________________________________________________________________________________________________________
Reported CPU speed: 2195.0 MHz
Measured CPU speed: 1448.0 MHz (approx.)
Note: reported execution times may be calculated based on a fixed reported CPU speed. Disable variable speed settings like Intel Speed Step and AMD Cool N Quiet in the BIOS setup for more accurate results.
_________________________________________________________________________________________________________
MEASURED INTERRUPT TO USER PROCESS LATENCIES
_________________________________________________________________________________________________________
The interrupt to process latency reflects the measured interval that a usermode process needed to respond to a hardware request from the moment the interrupt service routine started execution. This includes the scheduling and execution of a DPC routine, the signaling of an event and the waking up of a usermode thread from an idle wait state in response to that event.
Highest measured interrupt to process latency (µs): 42259.421448
Average measured interrupt to process latency (µs): 6.597696
Highest measured interrupt to DPC latency (µs): 11908.977124
Average measured interrupt to DPC latency (µs): 0.801767
_________________________________________________________________________________________________________
MEASURED SMI, IPI AND CPU STALLS
_________________________________________________________________________________________________________
The SMI, IPI and CPU stalls value represents the highest measured interval that a CPU did not respond while having its maskable interrupts disabled.
Highest measured SMI or CPU stall (µs) 102.631423
_________________________________________________________________________________________________________
REPORTED ISRs
_________________________________________________________________________________________________________
Interrupt service routines are routines installed by the OS and device drivers that execute in response to a hardware interrupt signal.
Highest ISR routine execution time (µs): 911.234624
Driver with highest ISR routine execution time: ndis.sys - NDIS 6.20-Treiber, Microsoft Corporation
Highest reported total ISR routine time (%): 0.029916
Driver with highest ISR total time: ataport.SYS - ATAPI Driver Extension, Microsoft Corporation
Total time spent in ISRs (%) 0.069944
ISR count (execution time <250 µs): 302620
ISR count (execution time 250-500 µs): 0
ISR count (execution time 500-999 µs): 5
ISR count (execution time 1000-1999 µs): 0
ISR count (execution time 2000-3999 µs): 0
ISR count (execution time >=4000 µs): 0
_________________________________________________________________________________________________________
REPORTED DPCs
_________________________________________________________________________________________________________
DPC routines are part of the interrupt servicing dispatch mechanism and disable the possibility for a process to utilize the CPU while it is interrupted until the DPC has finished execution.
Highest DPC routine execution time (µs): 9663.043280
Driver with highest DPC routine execution time: ataport.SYS - ATAPI Driver Extension, Microsoft Corporation
Highest reported total DPC routine time (%): 0.139961
Driver with highest DPC total execution time: ataport.SYS - ATAPI Driver Extension, Microsoft Corporation
Total time spent in DPCs (%) 0.373844
DPC count (execution time <250 µs): 1389583
DPC count (execution time 250-500 µs): 0
DPC count (execution time 500-999 µs): 12
DPC count (execution time 1000-1999 µs): 7
DPC count (execution time 2000-3999 µs): 1
DPC count (execution time >=4000 µs): 0
_________________________________________________________________________________________________________
REPORTED HARD PAGEFAULTS
_________________________________________________________________________________________________________
Hard pagefaults are events that get triggered by making use of virtual memory that is not resident in RAM but backed by a memory mapped file on disk. The process of resolving the hard pagefault requires reading in the memory from disk while the process is interrupted and blocked from execution.
NOTE: some processes were hit by hard pagefaults. If these were programs producing audio, they are likely to interrupt the audio stream resulting in dropouts, clicks and pops. Check the Processes tab to see which programs were hit.
Process with highest pagefault count: msmpeng.exe
Total number of hard pagefaults 5488
Hard pagefault count of hardest hit process: 3802
Highest hard pagefault resolution time (µs): 386880.085649
Total time spent in hard pagefaults (%): 4.428135
Number of processes hit: 14
_________________________________________________________________________________________________________
PER CPU DATA
_________________________________________________________________________________________________________
CPU 0 Interrupt cycle time (s): 6.306248
CPU 0 ISR highest execution time (µs): 911.234624
CPU 0 ISR total execution time (s): 0.709019
CPU 0 ISR count: 302625
CPU 0 DPC highest execution time (µs): 9663.043280
CPU 0 DPC total execution time (s): 3.614843
CPU 0 DPC count: 1334226
_________________________________________________________________________________________________________
CPU 1 Interrupt cycle time (s): 0.919728
CPU 1 ISR highest execution time (µs): 0.0
CPU 1 ISR total execution time (s): 0.0
CPU 1 ISR count: 0
CPU 1 DPC highest execution time (µs): 8652.991344
CPU 1 DPC total execution time (s): 0.039254
CPU 1 DPC count: 15276
_________________________________________________________________________________________________________
CPU 2 Interrupt cycle time (s): 1.222529
CPU 2 ISR highest execution time (µs): 0.0
CPU 2 ISR total execution time (s): 0.0
CPU 2 ISR count: 0
CPU 2 DPC highest execution time (µs): 131.888838
CPU 2 DPC total execution time (s): 0.090601
CPU 2 DPC count: 26304
_________________________________________________________________________________________________________
CPU 3 Interrupt cycle time (s): 0.971071
CPU 3 ISR highest execution time (µs): 0.0
CPU 3 ISR total execution time (s): 0.0
CPU 3 ISR count: 0
CPU 3 DPC highest execution time (µs): 87.194533
CPU 3 DPC total execution time (s): 0.044943
CPU 3 DPC count: 13801
das demo project test ich nochmal.
ansonsten danke nochmal.
lg
magnushori
- - - Aktualisiert - - -
hab hier noch 2 screenshots gemacht


